当前位置:网站首页>[pytoch] tensorboard usage: scalar curve, histogram, model structure diagram
[pytoch] tensorboard usage: scalar curve, histogram, model structure diagram
2022-07-21 02:22:00 【zoetu】
Pytorch Official documents :https://pytorch.org/docs/stable/tensorboard.html
Tensorflow Official documents of :https://www.tensorflow.org/tensorboard
TensorBoard It is a powerful tool for real-time detection and visualization of machine learning . It can track and visualize in real time loss、acc Isoscalar , You can use histogram 、 Distribution diagram to show the changes of weight and gradient distribution , You can also show the architecture diagram of the model , You can also project the embedded vector into a lower dimensional space for visualization, and so on .
origin
TensorBoard The first is TensorFlow Visual toolkit for . In the early PyTorch It is not supported Tensorboard Of , therefore lanpa The boss developed a fully supported PyTorch Of Tensorboard tool kit TensorboardX. Later on PyTorch 1.1.0 edition , Official and TensoBoard Cooperation has joined the right Tensorboard Support interface torch.utils.tensorboard, And the use method and TensorboardX Almost the same . comparison Visdom,Tensorboard Powerful , More users .
install & Import
pip install tensorboard
from torch.utils.tensorboard import SummaryWriter
Usage method
【SCALARS】 Record scalar information
As long as it is scalar information , You can use SCALARS To record , such as :loss、accuracy、mse、F-score、 Dynamic learning rate 、dropout Retention rate of 、 Hide the parameter information in the layer ( Such as : The most value 、 mean value 、 Variance and so on ) etc. .
Usage method :
Insert the following key code into the corresponding position in your machine learning code .
# strat training
writer = SummaryWriter(log_dir='./log/')  # 【 Key code 1】

for epoch in range(10):
    train_loss = train_one_epoch(epoch)
    val_loss, rmse = eval_model(epoch)

    writer.add_scalar(tag='TrainLoss', scalar_value=train_loss, global_step=epoch)  # 【 Key code 2】
    writer.add_scalars(main_tag='Metrics', tag_scalar_dict={
    'ValLoss':val_loss,
                                                            'RMSE': rmse}, global_step=epoch)  # 【 Key code 3】
writer.close()  # 【 Key code 4】
Code instructions :
- 【 Key code 1】 Initialize a writer,log_dir Is the directory where the log files are saved , The default is ./runs/.
- 【 Key code 2】 Record this moment train_loss Scalar values ,tag Is a data identifier ,scalar_value Is the scalar value to be recorded ,global_step It's the first step .
- 【 Key code 3】 And code 3 Function as , However, it can record multiple scalar values at the same time .main_tag Is the parent label ,tag_scalar_dict It's a dictionary { Child tags : Scalar value to be recorded },global_step It's the first step .
- 【 Key code 4】 close writer. You can also use with SummaryWriter(log_dir=‘./log/’) as writer: similar python File operation .
After running your machine learning code , In the current directory shift+ Right mouse button Open the command line, enter the following command and enter (./log/ It is the directory where the log you wrote in the code is saved ):
tensorboard --logdir ./log/
Open the browser , Enter the address prompted on the command line (http://localhost:6006/), enter , The renderings are as follows :
Use the refresh function in the upper right corner to view the training situation in real time .
Subgraph grouping
When a lot of scalar value information is recorded , A large number of images will be stacked, resulting in UI Chaos is not beautiful . You can use the grouping function , It's also very simple to use , Only the parameters tag perhaps main_tag Hierarchical naming is enough , The code is as follows :
from torch.utils.tensorboard import SummaryWriter
import numpy as np

with SummaryWriter() as writer:
    for n_iter in range(100):
        writer.add_scalar('Loss/train', np.random.random(), n_iter)
        writer.add_scalar('Loss/test', np.random.random(), n_iter)
        writer.add_scalar('Accuracy/train', np.random.random(), n_iter)
        writer.add_scalar('Accuracy/test', np.random.random(), n_iter)
design sketch :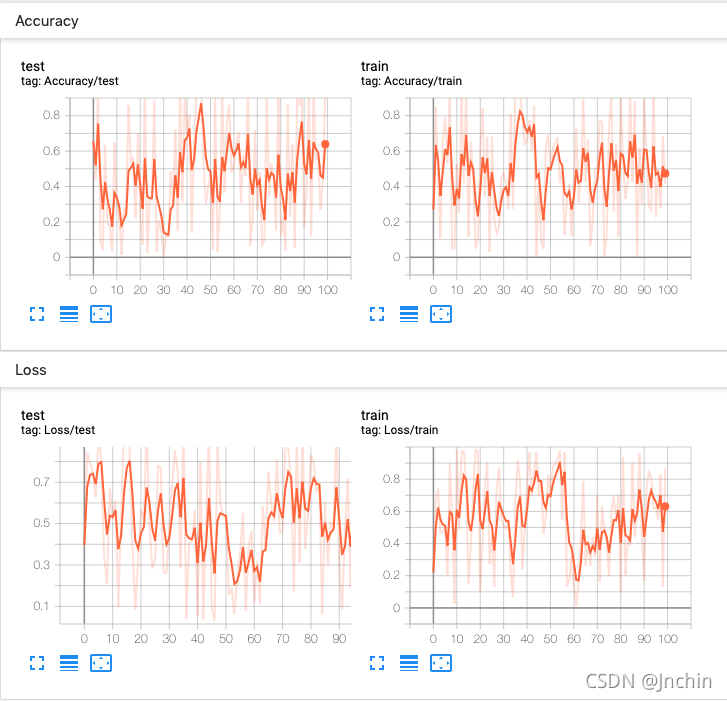
thus , For some simple machine learning tasks , These tools are enough . Now let's start the advanced operation .
【HISTOGRAM】 Record the distribution information
histogram( Histogram ) It is used to display Tensor How the distribution of changes over time . Visualize by displaying a large number of histograms at different time points tensor The change of . Usually used to record Tensor Distribution changes of ( Such as : gradient 、 The weight 、 Neuron output, etc ), For example, check the distribution of neuron output before activation and the distribution changes after activation .
Usage method :
# strat training
writer = SummaryWriter(log_dir='./log')
for epoch in range(100):
    train_loss = train_one_epoch(epoch)
    val_loss, rmse = eval_model(epoch)

    # 【 Key code 】
    for name, param in model.named_parameters():
        writer.add_histogram(tag=name+'_grad', values=param.grad, global_step=epoch)
        writer.add_histogram(tag=name+'_data', values=param.data, global_step=epoch)

writer.close()
Code instructions :
- add_histogram The usage of is the same as the above ,tag Is a data identifier ,values Is the data to be recorded ,global_step It's the first step .
- Be careful :values What is passed in is a multidimensional array (Tensor perhaps array) Not scalar , If you pass in a high-dimensional array , Will flatten it to one dimension first , Then divide the barrels into histograms . Statistical methods and numpy.histogram similar .
After executing the above code –> Command line tensorboard --logdir ./log/ –> browser http://localhost:6006/–> It opens at 【HISTOGRAMS】 tab , The effect is as follows :
You can see that there are two more tabs than before 【HISTOGRAMS】 and 【DISTRIBUTIONS】, In fact, these two are used to check histogram Of statistical results , But the former shows the statistical results in the form of a square , The latter provides more abstract statistical information .
On the tab 【HISTOGRAMS】 Two display modes are provided in :OVERLAY and OFFSET( top left corner ), You can see the histogram distribution from different perspectives .
Let's interpret the meaning of the two diagrams :
【HISTOGRAMS】
On the tab 【HISTOGRAMS】 The middle name is dec_embedding.feature_embedding.Embed.weight After the image window , As shown below :

You can see that this figure shows the gradient distribution image of the network layer . Gradient is just a vector , You can think of it as an array , In statistics, all gradients will be flattened into a one-dimensional array , Then use histogram statistics .
The horizontal axis represents the distribution range of element values in these gradients , The vertical axis indicates the number of rounds .
When you put the mouse on the picture , There will be a black line and a number dot , As shown in the figure above, the black line indicates the 30 The histogram of statistics during the round , This black dot indicates the number 30 Sometimes 922 The values of gradient elements are equal to 0.0000175.
The following information can be obtained from the above figure :
1、 It's about the 15 After the round , The distribution of element values in the gradient will no longer change , And all focus on 0 near .
2、 combination 【SCALARS】 in loss The curve remains unchanged , It shows that the model may encounter a training bottleneck or saddle point , Or network degradation ?
3、 If there is any error or supplement , Hope to point out .
【DISTRIBUTIONS】
【DISTRIBUTIONS】 Figure and 【HISTOGRAMS】 The data sources shown in the figure are the same , Just show the same content in different ways .
On the tab 【DISTRIBUTIONS】 The middle name is dec_embedding.feature_embedding.Embed.weight After the image window , Here's the picture :
The abscissa represents the number of rounds , The ordinate represents the distribution range of element values in the gradient .
Different colors indicate the frequency of element values in a certain region in the gradient , The darker the color, the more frequent it appears .
The following information can be seen from the above figure :
1、 overall , The element value in the gradient is 0 The color around is generally the darkest , That is to say 0 The weight value of the nearby area has the highest frequency .
2、 In the 15 After the round , The frequency of gradient value does not change, and the overall frequency range becomes larger , It shows that it is likely that the direction of the gradient has been changing back and forth , The element value of the gradient does not change , I think it may be a small gradient oscillation .
3、 If there is any error or supplement , Hope to point out .
【GRAPHS】 Record the model architecture
【GRAPHS】 Model structure can be recorded , Visual network structure and training process .
Usage method :
#  Write a model
class MyModel(nn.Module):
    def __init__(self, i_f=2, o_f=1):
        super(MyModel, self).__init__()
        self.linear1 = nn.Linear(i_f, 4)
        self.linear2 = nn.Linear(4, o_f)
    def forward(self, x):
        x = self.linear1(x)
        x = nn.functional.relu(x)
        x = self.linear2(x)
        return x
model = MyModel()

# 【 Key code 】
writer = SummaryWriter(log_dir='./log')
fake_input = torch.randn(16,2)
writer.add_graph(model=model, input_to_model=fake_input)
writer.close()
Code instructions :
- Direct will add_graph Just insert the code after the model instantiation , But here's the thing , Before that, you need to create a fake input data by yourself .
- Parameters model It's your instantiated model , Parameters input_to_model Is the data input to the model .
The renderings are as follows :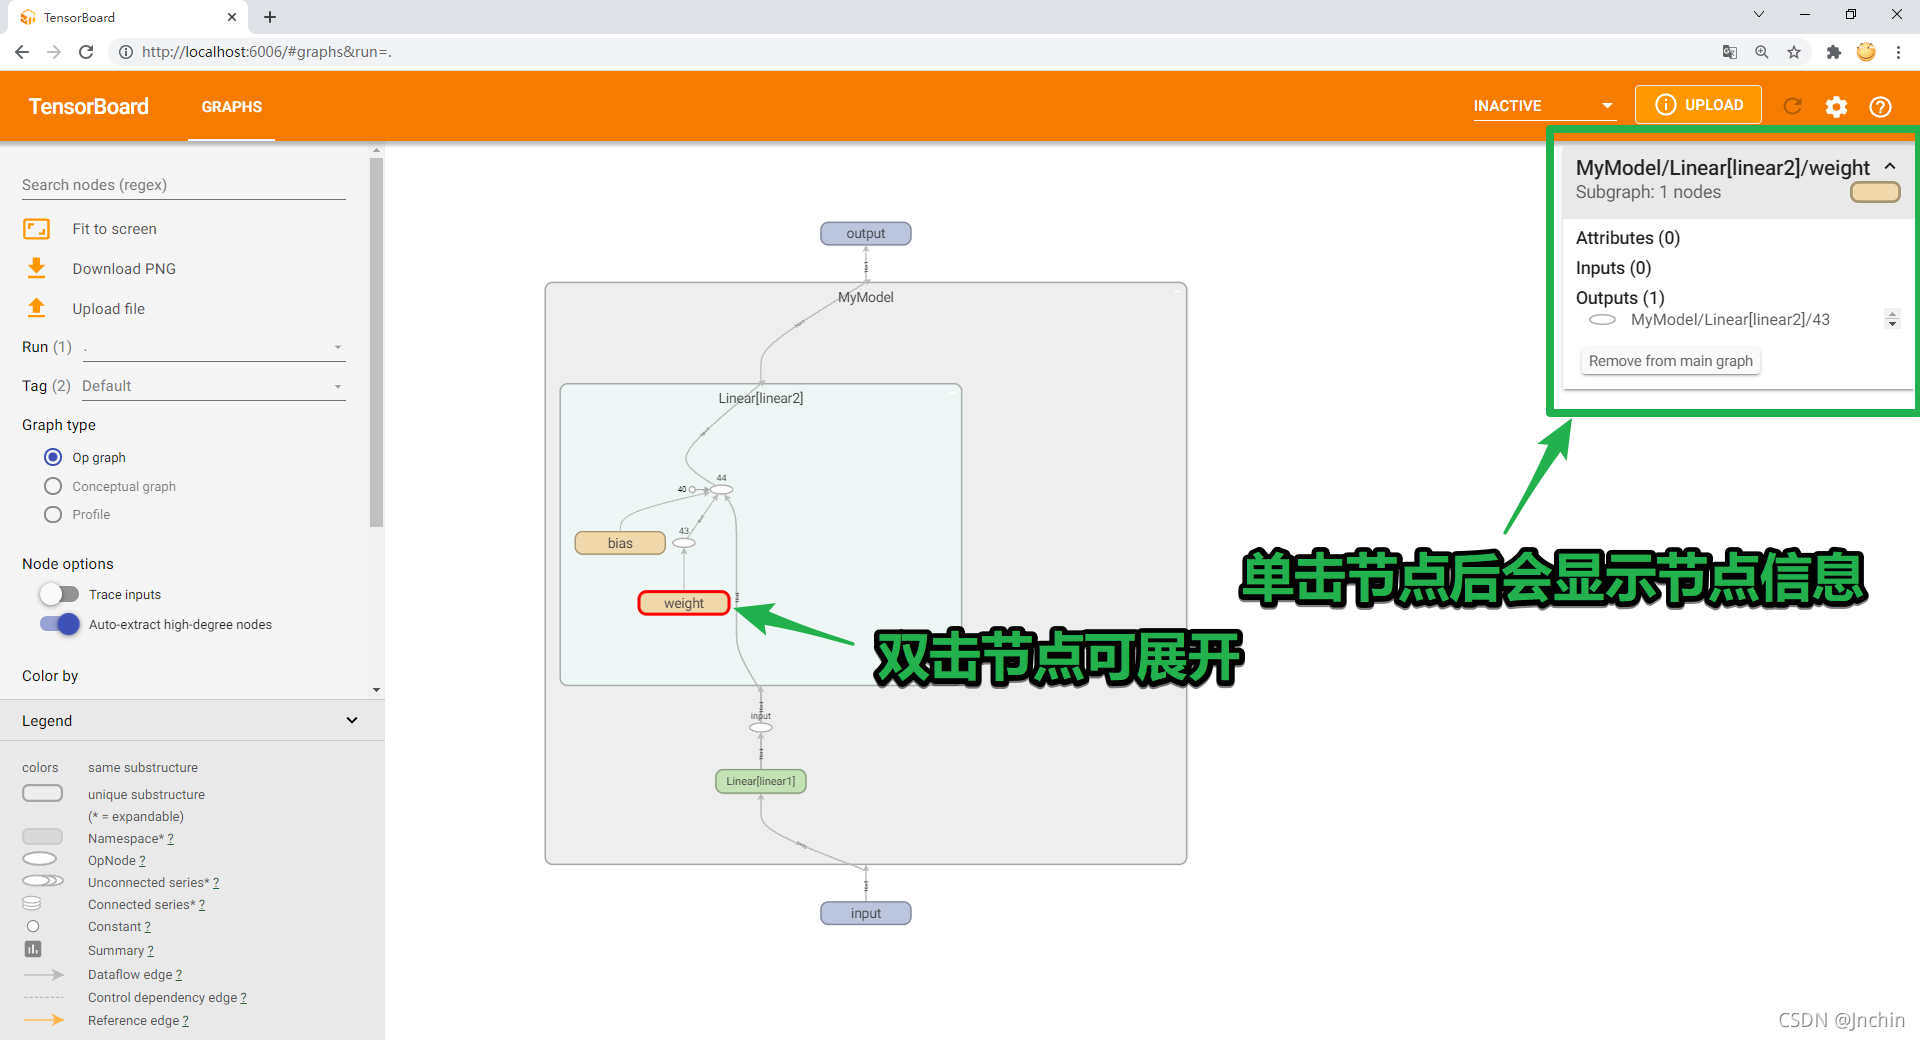
【 Other features 】 I can't use it for the time being , It will be supplemented later
Common are :
- add_image # Add image data
- add_images # Add multiple image data
- add_figure # take matplotlib The graph is rendered as an image and added to the summary . need matplotlib package .
- add_video # Add video data
- add_audio # Add audio data
- add_text # Add text book data
- add_embedding # Add the number of embedded projectors
- add_pr_curve # Add precise recall curve
- add_custom_scalars # By means of “ Scalar ” Collect chart labels in to create special charts . Be careful , This function can only be used for each SummaryWriter() Object call once , Cannot be used in a loop .
- add_hparams # Add a group to be in TensorBoard Super parameters for comparison in .
- add_mesh # towards TensorBoard Add grid or 3D Point cloud .
See for specific use details Official documents
What I use :HISTOGRA Record the distribution information
from torch.utils.tensorboard import SummaryWriter
# strat training
writer = SummaryWriter(log_dir='./log')
# for epoch in range(3):
    # 【 Key code 】
for name, param in quantized_model.named_parameters():
    # writer.add_histogram(tag=name+'_grad', values=param.grad, global_step=epoch)
    writer.add_histogram(tag=name+'_data', values=param.data)
writer.close()
Comment out part of the code , Because I don't have a training model , There are no parameters in the model _grad suffix .
Run the command :
tensorboard --logdir ./log/
vscode Browser access will pop up , View the output directly :
边栏推荐
- Load balancing usage
- SQL Server 2008 R2 uninstall failed
- Category loss and location loss of target detection
- PPT简明
- 35- [go] reflection of golang
- [special for training course] Introduction to storage API
- Redefine analysis - release of eventbridge real-time event analysis platform
- Regular expression tutorial notes
- Calculation of parameter quantity (param) and floating point calculation quantity (flops) in the network
- Redis review
猜你喜欢

5G时代到来,VR全景制作是值得创业的行业

Leetcode sword finger offer 32 - I. print binary tree from top to bottom

kettle

卷积神经网络CNN常用的几个模型

Exness: the dollar fell moderately, and the RBA called for further interest rate hikes

647. 回文子串【双指针:两种对称情况-回文串】(字符串S中回文子串的个数)
![[special for training courses] CPU_ Initialization of context to switch](/img/70/59a7eb7f12a386d71096652ec1c4b3.png)
[special for training courses] CPU_ Initialization of context to switch

C language file management function and principle

okcc呼叫中心语音短信与语音通知的区别
BOM browser object model (Part 1) - overview, common events of window object, JS execution mechanism (close advertisement after 5 seconds, countdown case, send SMS countdown case)
随机推荐
存储过程和for循环插入数据
Exness: the dollar fell moderately, and the RBA called for further interest rate hikes
Locking is familiar with synchronized and lock, so what is the difference between them
Trax:如何打赢夏日冰淇淋市场的甜蜜之战?
PHP advanced iterator and generator yield & MySQL how to send data results
The difference between break, continue and return
ECS和云数据库管理
Redefine analysis - release of eventbridge real-time event analysis platform
Idea activation
请别再使用 SimpleDateFormat 格式化时间了,DateTimeFormatter 更出色!
Use ECs and OSS to set up personal network disk
06.02 二叉树遍历
MySQL - partition column (horizontal partition vertical partition)
网络与VPC之动手实验
Leetcode sword finger offer 32 - ii Print binary tree II from top to bottom
Batch梯度下降、随机梯度下降和mini-batch梯度下降
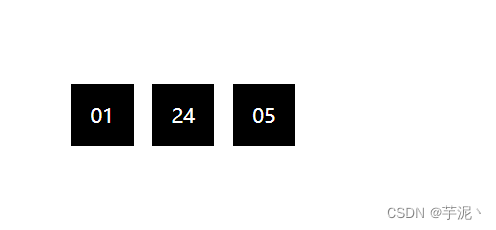
分享一个好玩的JS小游戏
使用ECS和OSS搭建个人网盘
36- [go] IO stream of golang
负载均衡使用