当前位置:网站首页>[yolov5 practice 4] traffic sign recognition system based on yolov5 - model test and evaluation
[yolov5 practice 4] traffic sign recognition system based on yolov5 - model test and evaluation
2022-07-22 19:06:00 【Make progress every day】
Practical blog Guide ( Ongoing update …):
- Construction of actual combat environment
- Custom datasets
- model training
- Model testing and evaluation
- YOLOv5 Integrate PyQt5
One 、 Parameter description
In the last step , We trained the model , The screenshot of the training is as follows :
Explain the meaning of each field here :
- Epoch: num0/num1,num0 Indicates the current number of rounds ,num1 Indicates the total number of rounds . The picture shows 0/19, To express a total of 20 round , The present is the 0 round .
- gpu_mem: GPU Memory usage .
- The middle ones will be explained in the training results .
- The rightmost digits indicate the current training status .8/57 This time epoch Need to carry out 5 Sub iteration , The current number of iterations is 8.
- 00:11<01:09, This time epoch Has run 11s, It is estimated that it needs to be operated 1m9s.1.43s/it Indicates that each iteration probably requires 1.43s.( It can be calculated simply ,1.43*57=81.51≈1m9s+11s=80s). With the help of these parameters, you can judge your every epoch About how long it will take , Then multiply it by yours epoch, We can roughly infer the training time .
Two 、 Evaluation of results
After training , It will be in your corresponding result directory (runs/train/expi,i For your number of training ) Next . For example, I have been trained three times before to test whether there is a problem , Without deleting the relevant files , Then complete the training for the fourth time , So the results are saved in exp3 Next , Pictured :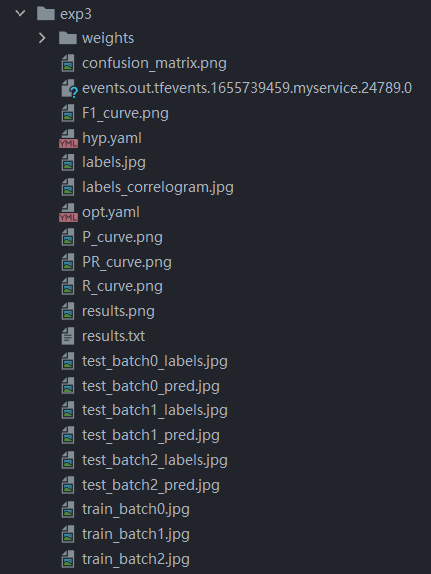
weights/ The catalog saves the best and last training models in your training process .
exp3/ Contains many files and pictures , Here's a brief introduction result.png, Briefly introduce other documents :
2.1 results.png
results.png as follows :
- Box: YOLO V5 Use GIOU Loss As bounding box The loss of ,Box Presumably GIoU The loss function means , The smaller the box, the more accurate , That is, the coincidence degree between the prediction box and the real value box ;
- Objectness: It's supposed to be target detection loss mean value , The smaller the target, the more accurate the detection ;
- Classification: It is presumed to be classified loss mean value , The smaller the size, the more accurate the classification ;
| real \ forecast | T | F |
|---|---|---|
| T | TP | FN |
| F | FP | TN |
- Precision: Precision rate ( Find the right positive class / All positive classes found ). Its calculation formula is : P r e c i s i o n = T P T P + F P Precision=\frac{TP}{TP+FP} Precision=TP+FPTP, Indicates the probability that the sample you think is true is actually true , Indicates your accuracy .
- Recall: Recall rate ( Find the right positive class / All the positive classes that should have been found right ). Its calculation formula is : R e c a l l = T P T P + F N Recall=\frac{TP}{TP+FN} Recall=TP+FNTP, It means the probability of finding the right one in all the samples that are true .
- [email protected] & [email protected]:0.95: Namely mAP Yes, it is Precision and Recall As the area enclosed by two axes ,m Means average ,@ The following number denotes a decision iou Is the threshold of positive and negative samples ,@0.5:0.95 The threshold value is taken as 0.5:0.05:0.95 Take the mean value after .
General training results mainly observe the fluctuation of accuracy and recall rate ( If the fluctuation is not great, the training effect is better ). Then observe [email protected] & [email protected]:0.95 Evaluate the training results , Generally speaking, the larger the two values, the better , It means your model is better .
2.2 Screenshots of other files
confusion_matrix.png( Confusion matrix )
Confusion matrix can summarize the prediction results of classification problems , It shows which part of the classification model will be confused when making predictions . The vertical axis is the predicted value , The horizontal axis is the true value .
F1_curve:
F1 The relationship between score and confidence .F1 fraction (F1-score) It's a measure of classification , It's accuracy precision And recall rate recall Harmonic mean of , The maximum is 1, The minimum is 0, 1 It's the best ,0 Is the worst
labels.jpg
The first picture classes: The amount of data in each category
The second picture labels: label
The third picture center xy
The fourth picture labels The length and width of the label
P_curve.png :
Accuracy rate precision And confidence confidence Diagram for
PR_curve.png:
PR In the curve P It stands for precision( Accuracy ),R It stands for recall( Recall rate ), It represents the relationship between accuracy and recall , In general , take recall Set to abscissa ,precision Set to ordinate .PR The area enclosed under the curve is AP, All categories AP The average value is Map.
If PR One of the curves in Figure A Completely enclose the curve of another learner B, It can be asserted that A Better performance than B, When A and B When crossing occurs , It can be compared according to the area under the curve . General training results mainly observe the fluctuation of accuracy and recall rate ( If the fluctuation is not great, the training effect is better ).
R_curve.png : The relationship between recall rate and confidence

Observe the screenshot above and you can find , Blogger's model is spicy chicken ( After all, the equipment doesn't work , Fewer datasets are used , Resulting in low accuracy ).
3、 ... and 、 Model test
python detect.py --weights weights/best.pt --source data/images/test --img-size 640 --device 0
The above command specifies that the weight of the model used in the test is the trained model best.pt, The test data set is test/ Catalog , It can also be specified as a single picture , The process of testing is as follows :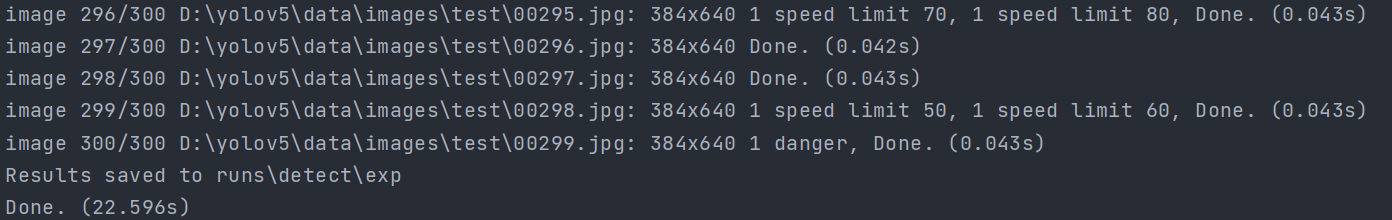
The results are stored in runs/detect/exp/ Under the table of contents . An example is shown in the figure :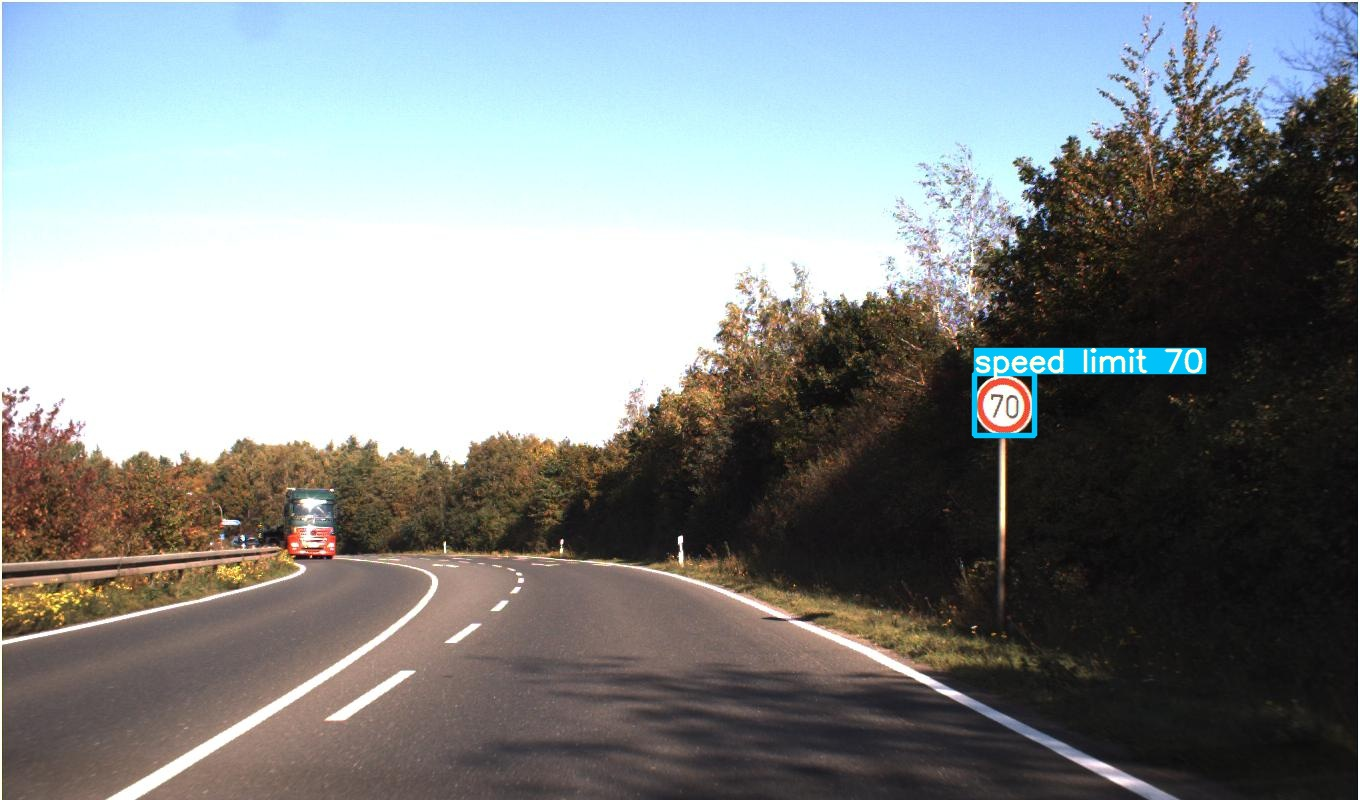
边栏推荐
- PTA basic questions 7-28 monkeys choose the king (simple method)
- webFlux 中使用 openFeign 实现远程调用遇到的问题
- 【链表技巧汇总】141.环形链表(简单)
- Date operation in shell script
- MySQL statement execution order
- Pat class B 1010 univariate polynomial derivation (problem meaning understanding)
- Sprintf rewriting of QT; The content under QT is scaled according to the scaling of the interface (without changing the font size)
- PCV, PIL, pilot installation
- Pat grade B 1020 moon cake (pay attention to the measuring points)
- 逻辑回归中的损失函数
猜你喜欢

Six dimensional space

微信扫网址的二维码,却只显示链接地址,无法跳转到网页的解决办法

Leetcode 2028. find out the missing observation data

MNIST手写数字识别案例TensorFlow 2.0 实践
Flink learning notes (IV) Flink runtime architecture

交叉熵损失函数

STM32+ESP8266+MQTT协议连接OneNet物联网平台

高手常用的15 种 SQL 优化
Flink learning notes (VII) processing function

numpy.reshape完成图像切割
随机推荐
Flink学习笔记(三)Flink安装部署
程序员面试金典面试题 01.03. URL化
sql 语法中 join 的所有用法总结(简单例子)
在各類數據庫中隨機查詢n條數據
Go language learning: go language journey - exercise questions and reference answers
数据存储分区--范围分区,哈希分区,列表分区,性能调优必不可缺少的部分
shell 脚本中日期运算
[QT source code reuse] qdatetimeedit drop-down button event response
fucking-algorithm
fucking-algorithm
在各类数据库中随机查询n条数据
Flink learning notes (V) datastream API
Leetcode 116. fill in the next right node pointer of each node
STM32+ESP8266+MQTT协议连接OneNet物联网平台
Cross entropy loss function
Go language learning: go language journey (III)
Flink learning notes (III) Flink installation and deployment
Server disk IO performance tuning
Learning to Incorporate Structure Knowledge for Image Inpainting
pytorch自定义dataloder的时候,返回参数