当前位置:网站首页>Apache bench (AB) stress test Overview - from 0 to 1, covering all major use scenarios
Apache bench (AB) stress test Overview - from 0 to 1, covering all major use scenarios
2022-07-21 08:16:00 【Rokas. Yang】
Preface
Apache Bench(ab) Mainly for HTTP Service provides performance stress testing , Here is a summary of ab Pressure measurement method used in daily use .
ab Closer to pragmatism , Like other tools, it does not include a large number of parameters with few usage scenarios , When you see man perhaps --help When helping the dense parameters displayed in the document , It is inevitable to persuade some people to retreat .
This article prefers production 、 Daily use , You won't drill through every parameter , When you read this article , It must have come with the need to solve the problem , Try to let you use the least time cost , For business performance 、 There is a roughly complete assessment of load capacity .
One 、 How to install ab
1.Linux
It is recommended to install directly from the software source , The dependencies required by each component will be installed by default , The compilation and installation requires manual installation of dependencies , The naming of the dependent components of each distribution may also be different , You may also encounter various errors on the way , It's like a recursion , You have to sink deep , So I prefer practicality and minimalism , Unless the version of the software source is too old to meet the requirements , Or look at each version Changelog Then confirm to specify an installation version , Then you can choose to compile and install . Installation is not the focus of this article , Try to pass .
Distribution version | Installation command |
|---|---|
Arch | pacman -Sy apache |
CentOS | yum install -y httpd-tools |
Debian/Ubuntu | apt install -y apache2-utils |
2.Windows
Windows client See this link , Download the compressed file and unzip it , take bin The directory is set to environment variable or cmd Enter into bin Under the table of contents , Then use ab Command is enough .
Two 、 Parameter optimization of pressure measuring machine
When using pressure measuring tools for pressure testing , Will be limited by tool performance or machine performance , If it is limited by the hardware performance of the machine , It is recommended to use multiple clients for pressure testing , At the same time, the single machine itself also has some network related kernel parameters that can be optimized .
1.tcp_fin_timeout
MSL namely :Maximum Segment Lifetime, It defines the maximum time that any message is allowed to survive , If it exceeds, discard .
that tcp_fin_timeout It's used to set up MSL Of , The default is 60s.
cat /proc/sys/net/ipv4/tcp_fin_timeout2.tcp_tw_reuse
linux The number of file handles allocated to each user is limited , After disconnection , Ports and related resources will not be released immediately , But into time_wait state , wait for 2MSL Enter after CLOSE state , At this time, the connection is released , You can refer to RFC793 The definition of :
obviously , In the pressure measurement scenario , We need to build as many pressure measuring machines as possible in a short time TCP Connect , and time_wait If the state remains 2MSL( namely 2 minute ), So this 2MSL Corresponding to time_wait Once the occupied handle reaches the upper limit , Cannot add new TCP Connect .
We need to take tcp_tw_reuse Parameters on , Let the system turn on time_wait State reuse , Allow resources in this state to be reused for new TCP Connect .
Just open it temporarily :
sysctl -w sysctl net.ipv4.tcp_tw_reuse = 1perhaps :
echo 1 > /proc/sys/net/ipv4/tcp_tw_reuse If you need to permanently open , You need to write to /etc/sysctl.conf, And perform sysctl -p take effect .
3.tcp_tw_recycle
seeing the name of a thing one thinks of its function , This parameter is used to recycle time_wait State resources , It's usually with tcp_tw_reuse In combination with .
Temporarily open :
sysctl -w sysctl net.ipv4.tcp_tw_recycle = 1perhaps :
echo 1 > /proc/sys/net/ipv4/tcp_tw_recycle If you need to permanently open , You need to write to /etc/sysctl.conf, And perform sysctl -p take effect .
4.ip_local_port_range
This parameter indicates the range of ports that can be used for local to external connections , The default value of the parameter is 32768 60999, That is, a single machine can create a total of 28231 A connection :
According to the pressure test scenario , Adjust this parameter appropriately .
For example, increase more 1000 Ports , It can be :
echo '32768 61999' > /proc/sys/net/ipv4/ip_local_port_range5. Count the number of connections in each state
Last , Count the number of connections in each state , It can be :
netstat -an|awk '/tcp/{print $6}'|sort |uniq -c
netstat -an|awk '/tcp/{s[$6]++}END{for(i in s)print i,s[i]}'3、 ... and 、 Start the stress test journey
Use --help You can see the parameter support list :
The pressure measurement format is :ab [options] [http[s]]://]hostname[:port]/path/
Be careful :options Don't put it on hostname Back , This is not supported .
1. Pressure measurement short connection (-m/-c/-n)
Use HTTP GET request , Maximum concurrency per time 1000, Pressure measurement quantity 10000 Time ,:
ab -m GET -c 1000 -n 10000 http://hostname/Be careful : The target must be followed by a path , If it is the root path, bring "/", Like the one above hostname/, Otherwise, an error will be reported .
paraphrase :
Parameters | paraphrase |
|---|---|
-m | Appoint HTTP Request method , Such as GET/POST/HEAD/PUT etc. , Do not specify this parameter to send by default GET. |
-c | The maximum number of requests at the same time , That is, the number of concurrent requests . |
-n | Total number of requests . |
Output information :
Server Software:        nginx
Server Hostname:        xxx
Server Port:            80

Document Path:          /
Document Length:        231 bytes  # Returned page size

Concurrency Level:      1000       # Number of concurrent connections 1000
Time taken for tests:   0.457 seconds   # Total time
Complete requests:      10000          # Always complete the request
Failed requests:        0              # Failed request
Total transferred:      4560000 bytes  # Total bytes transferred
HTML transferred:       2310000 bytes   #html Number of bytes transferred
Requests per second:    21896.07 [#/sec] (mean)  # Average requests per second
Time per request:       45.670 [ms] (mean        # Time per concurrent request
Time per request:       0.046 [ms] (mean, across all concurrent requests)  # The average time each request actually runs .
Transfer rate:          9750.59 [Kbytes/sec] received  # Transmission rate

Connection Times (ms)   # Connection processing time during stress testing
              min  mean[+/-sd] median   max
Connect:        1   20   2.7     20      28
Processing:     7   24   5.0     23      43
Waiting:        1   17   4.8     16      33
Total:         22   43   4.1     43      57

Percentage of the requests served within a certain time (ms) # The proportion of request response time in a certain time
  50%     43                      # Half of the requests are completed , Statistical average response time , And so on
  66%     44
  75%     46
  80%     47
  90%     48
  95%     50
  98%     52
  99%     55
100% 57 (longest request)Corresponding packet capture :
It's not hard to see. ,ab every time GET Will shake hands with the destination , Will not reuse the same TCP Connect , Sent in a very small time 10000 Time GET request , And establish 10000 Time , produce 10000 One session .
If a larger dose is needed , Such as :
ab -m GET -c 10000 -n 1000000 http://hostname/-c 10000, At most 10000 A request , Because the concurrency is large , The maximum number of files opened by a single user may be exceeded , At this time, you need to set ulimit:
ulimit -n 65535ulimit It's a kind of Linux The internal key function of the system , It has a set of parameters , Used to generate for it shell Set resource usage restrictions for processes and their children . Set user open files( The maximum number of files that a user can open ).
View the number of files opened by the current user , You can use the following command :
lsof -u `whoami` |wc -l2. Pressure gauge connection (-k)
ab -m GET -k -c 1000 -n 100000 http://hostname/Parameters | paraphrase |
|---|---|
-m | Appoint HTTP Request method , Such as GET/POST/HEAD/PUT etc. , Do not specify this parameter to send by default GET. |
-c | The maximum number of requests at the same time , That is, the number of concurrent requests . |
-n | Total number of requests . |
-k | keepalive, Use long connection , Try to reuse one TCP Connect . |
It is obvious that the long connection mode pressure measurement ,QPS There is a significant improvement , Because every time GET Resources try to reuse a connection , Unlike short connections, each time GET Shake hands before GET.
Simultaneously from HTTP Header field Connetction:keep-alive It can be seen that -k The parameter pressure measurement mode is in HTTP Add this field to the header :
Why is there no timeout or significantly longer response time at the opposite end during the pressure test ?
To say the least , At this time, the client request level <= Server business layer processing level , So only one client is used to test the server , If the opposite end does not reach the performance bottleneck , Then you can consider increasing the pressure measurement concurrency or multiple clients' pressure measurement at the same time .
Below is an Internet web The tester is for display :
The above figure shows that the server is already in high load mode , Unable to respond to the request normally and return 502 Status code .
Use htop Observe the load and memory occupation of the server ,CPU、 Memory is full :
Count the connections established by the server :
lsof -i :80|awk '/ESTABLISHED/{S+=1}END{print S}' this 1000 Connections are ab -c 1000 The specified quantity .
If you want to specify statistics IP Connections that have been established , It can be :
lsof -i :80|awk '/ESTABLISHED/&&/ipaddress/{S+=1}END{print S}'3. Specify the timeout period (-s)
-s s Used to specify the timeout , Unit second . from man The help document shows that this parameter is in 2.4.4 Later versions are available , And the default is 30s Overtime .
It's easy to use , It can be used together with other pressure measurement parameters .
In long connection mode , Every time GET The most requested 5s Treat as a timeout request :
ab -m GET -s 3 -k -c 1000 -n 10000 http://hostname/In short connection mode , Every time POST The most requested 5s Treat as a timeout request :
ab -m POST -s 5 -c 1000 -n 10000 'http://hostname/?username=xxx&passwd=xxx'4. Appoint TLS Version pressure test (-f)
-f Appoint TLS Protocol version :
How to know what protocol versions are supported on the opposite side ?
openssl s_client -connect hostname:443 -tls1/-tls1_2/-tls1_3 # Notice the "/" You can't write it directly , Only one at a time tls edition , More than one can be traversed by loop Or use Online website Query the supported TLS Protocol version .
Example :
Appoint TLS1.1 edition :
ab -f TLS1.1 -m GET -k -c 1000 -n 10000 https://hostname/ You can clearly see , The client is in TLS The handshake package declares to the server that it uses TLS1.1 edition :
HTTPS scenario , Different versions TLS、cipher Kit , The encryption and decryption strength is inconsistent , The performance of the loss will also be inconsistent , Therefore, it will also be intuitively reflected in QPS On .
5. Insert cookies(-C)
-C Is used to specify the cookies Information , The format is similar to key value pairs :
When it is necessary to perform pressure test in some scenarios that require login , By inserting cookies To maintain login status :
ab -m GET -k -c 500 -n 2000 -C 'cookie-name=value' http://hostname/By inserting cookies, You can test any resources that can only be accessed after login .
6. Specify proxy services (-X)
Pressure test through agents , Format : -X proxy[:port]
ab -m GET -X proxyip:port -k -c 500 -n 2000 http://hostname/Be similar to nginx Seven layer reverse proxy , The client request is sent to the proxy server , The proxy server requests the real server and returns it to the client .
7. Set up HTTP Head (-H)
-H Customize HTTP Head content
Appoint HOST:
ab -m GET -H 'Host:test.com' -c 1000 -n 10000000 -k http://hostname/At the same time specified HOST、UA Information, etc :
ab -m GET -H 'Host:domain' -H 'User-Agent: RokasYang/1.0 -c 1000 -n 10000000 -k http://hostname/ whatever HTTP The head can pass -H Parameter assignment .
8. Specify the total pressure measurement time (-t)
-t Used to limit the total duration of pressure measurement , Be similar to timeout command , The unit is in seconds , If it is not specified by default, there is no time limit .
Limit the maximum pressure measurement 5s end :
ab -m GET -t 5 -c 1000 -n 10000000 http://hostname/ You can also use capinfos Command to view the time of the first and last packets in the message , interval 5s:
9. use HAED Ask for a replacement GET(-i)
This parameter can also be used -m HEAD To replace , The effect is the same , All hair HEAD request .
ab -i -k -c 1000 -n 10000000 http://hostname/10. output to a file (-g/-e)
-g Output the measured value of each result to a file .
-e Record all requests in the percentage progress bar (1%-100%) Time consumed in , It's usually followed by csv Format file , namely Excel Format file .
Record the time of each request :
ab -k -c 1000 -n 10000 -g output http://hostname/therefore 1 Ten thousand requests will record ten thousand requests ( Remove the first line banner Information ).
Record the elapsed time of all requests under different progress :
ab -k -c 1000 -n 10000 -e output.csv http://hostname/Four 、 summary
If it is necessary to reflect that the business side tends to the most real or the highest bottleneck QPS performance , Long connection scenario is more applicable , Multiple requests reuse one TCP Connect , It saves a lot of short connections and new connections , Because of this , A long connection QPS It will always be higher than the short connection .
If the number of clients is small , The end-to-end business can carry the response normally without any 5XX HTTP State code words , You can increase the number of clients for pressure measurement , Want to grasp the most authentic service QPS performance , We need to find out whether the business is normal or abnormal / Unresponsive QPS critical point .
If you use different clients to test the same server ,QPS uneven , It's normal , When the hardware performance of different clients is different , The performance of the contract is limited , And QPS It is also closely related to network delay , Even a few ms The gap between , It may also bring multiple level QPS disparity , Especially in the small bag scenario , Each connection requires a lot of packets to interact , In this scenario, the delay gap brings QPS The gap should not be small .
Incidental PDF edition :
Apache Bench Overview of pressure measurement scheme
Apache Bench Overview of pressure measurement scheme ( Bright color plate )
边栏推荐
猜你喜欢

Highly recommended | overview of convolutional neural networks: from basic technology to research prospects

Grafana visual configuration chart time series
![[machine learning] dandelion Book 1](/img/e8/e0fa076f1b23054e472f7aaa0bb810.png)
[machine learning] dandelion Book 1

Redis ranking
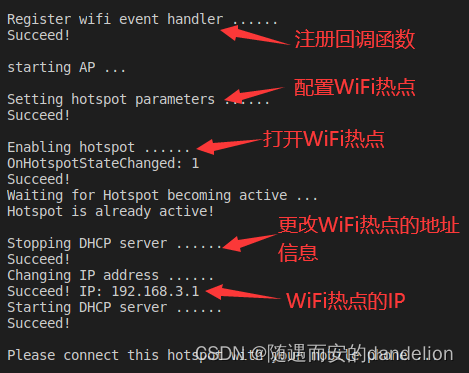
第2讲 Hi3861的WiFi实验-AP模式

不相交集类 (并查集)

Dynamic and static libraries (.So/dll,.A/lib)

C语言数组详解

嵌入式开发:成功进行代码审查的10个问题
![[golang] go parse XMIND](/img/45/f1d3daadcfea293e57e7ee3a6a623e.png)
[golang] go parse XMIND
随机推荐
Image operation and transformation of machine learning foundation (3)
干货丨重中之重:数据分析中常用指标及术语!
机器学习基础篇(3)之图像运算和变换
[machine learning] dandelion Book 1
周杰伦新专辑发布即被盗版盯上,知识产权如何保护?|上云那些事
租用香港服务器您需要知道的5件事
[golang] go parse XMIND
同步原语:锁
FC can the background script be run all the time? For example, keep going to the database to get data processing and write it to another database
Shell Scripting - get system information
Laravel 实现数据库和迁移文件的双向同步
你必须知道的4种 Redis 集群方案及优缺点对比
打通链上链下,构建全链条可信价值生态—长安链预言机
PX4模块设计之十:PX4启动过程
After Huawei, no one can stop apple. It is expected that iphone14 will be popular with hundreds of millions of domestic users
From giving up to mastering, these 13 recommended system papers must be read! [attached data]
iptables
面试真题2
redis实现周边景点由近到远排序
解决Visual Studio 2019 更新升级后,出现更新实体数据模型失败现象