当前位置:网站首页>[lttng learning journey] - trace control -- advanced
[lttng learning journey] - trace control -- advanced
2022-07-22 21:07:00 【Xiaoyangsu C】
List of articles
- In record event When adding context information
- Specifically to track certain threads
- record session Configuration saving and loading
- hold trace Data is sent through the network
- LTTng Health relay
- current sub-buffers snapshot
- Archive the current trace chunk (rotate a recording session)
- Add an “event rule matches” trigger to a session daemon
In record event When adding context information
Examples of information that can be added :
The process ID, thread ID, process name, and process priority of the thread from which LTTng emits the event.
The hostname of the system on which LTTng emits the event.
The Linux kernel and user call stacks (since LTTng 2.11).
The current values of many possible performance counters using perf,
for example:CPU cycles, stalled cycles, idle cycles, and the other cycle types.
Cache misses.
Branch instructions, misses, and loads.
CPU faults.
Any state defined at the application level (supported for the java.util.logging and Apache log4j tracing domains).
View all available contexts :lttng add-context --list
towards event record Add information :
lttng add-context --userspace --type=vpid --type=perf:thread:cpu-cycles

lttng add-context --userspace --type=perf:thread:raw:r0110:test
lttng add-context --kernel --type=perf:cpu:raw:r0013c:x86unhalted

lttng add-context --kernel --channel=my-channel \
                  --type=tid --type=callstack-user

lttng add-context --kernel --channel=my-channel \
                  --type='$app:retriever:cur_msg_id'
Specifically to track certain threads
It’s often useful to only allow processes with specific attributes to record events. For example, you may wish to record all the system calls which a given process makes (à la strace(1)).
The lttng-track(1) and lttng-untrack(1) commands serve this purpose.
Based on a variety of ID To operate , Not the name . If you change your name , Still follow ID Come after me . If someone else uses this ID. Will go after others .
pid Isn't this kind of thing dynamically allocated ? What is the reason for this design ?
Linux kernel tracing domain
Process ID (PID).
Virtual process ID (VPID).
This is the PID as seen by the application.
Unix user ID (UID).
Virtual Unix user ID (VUID).
This is the UID as seen by the application.
Unix group ID (GID).
Virtual Unix group ID (VGID).
This is the GID as seen by the application.
User space tracing domain
VPID
VUID
VGID
give an example :
stay create a recording session after , All are enabled . If used lttng track after , All will be shut down , Then only enable in the command .

perform :
lttng track --userspace --vpid=3,4,7,10,13
It becomes :
You can add or subtract at any time :
lttng track --userspace --vpid=1,15,16

lttng untrack --userspace --vpid=3,7,10,13

lttng track --userspace --vpid --all
Typical usage scenarios , Record some special objects :
stay create a recording session after , Close all first , Then enable what is needed . Start recording again .
lttng untrack --kernel --uid --all
lttng track --kernel --uid=http,11


record session Configuration saving and loading
Avoid duplicate configuration .
Instructions :
lttng save SESSION

lttng load SESSION
LTTng saves recording session configurations to $LTTNG_HOME/.lttng/sessions by default. Note that the LTTNG_HOME environment variable defaults to $HOME if not set.
LTTng saves all configuration parameters, for example:
- The recording session name.
- The trace data output path.
- The channels, with their state and all their attributes.
- The context fields you added to channels.
- The recording event rules with their state and conditions.
XML files.
hold trace Data is sent through the network
LTTng The record tracking data of the recording session can be sent to the remote system through the network , Instead of writing it to the local document system .
Start on the remote system relayd
lttng-relayd
In the target system :
lttng create my-session --set-url=net://remote-system
On the target system , Use... As usual lttng(1) Command line tools . When the record is active , The target user daemon will send the contents of the sub buffer to the remote relay daemon , Instead of refreshing them to the local document system . The relay daemon writes the received packets to its local document system .
LTTng Health relay
be based on relay daemon (lttng-relayd(8)), Allow Compatible Remote Trace The data reader is LTTng Read in the process of recording Trace data .
The relay daemon creates a tee: It forwards the tracking data to the local document system and connected real-time readers :

Create a new record session:
lttng create my-session --live
--live There will be a local relay daemon.
Then open a live reader at the far end :
 With   babeltrace2  For example :

babeltrace2 net://localhost/host/HOSTNAME/my-session

Replace HOSTNAME with the host name of the target system.
The next step is to operate as usual .
View available live recording sessions:
babeltrace2 net://localhost
current sub-buffers snapshot
Only record the period before the key condition occurs log, Avoid recording large amounts of data .

Snapshot save another copy of data , It won't be LTTng Cover .
Usage flow :
lttng create my-session --snapshot
 In this mode  channel It will automatically become overwrite Pattern .

 Then operate normally

 Then suggest stopping  stop record . Make the buffer complete .

lttng snapshot record --name=my-first-snapshot
Snapshot file and normal trace The file format is consistent .
View the snapshot storage location :
lttng snapshot list-output
There are also a series of instructions to change the network storage location , wait . Check the manual .. If you want to use it .
If you need someone to record the snapshot manually , Is it significant ?
Archive the current trace chunk (rotate a recording session)
Reference resources log rotate. Made a trace Of rotate.
I didn't understand too much , It roughly means to prevent snapshot data overlap caused by multiple snapshots in a short time . After execution, clear the buffer that takes away the data .
It should not be used .
Add an “event rule matches” trigger to a session daemon
Since 2.13
Because it's too new I suspect that the version I installed does not support .
ok I checked :
lttng (LTTng Trace Control) 2.13.7 - Nordicité
It should be supportive . hh.
I compile and install from source code, which is of course the latest .
Yes session daemon Add trigger condition , Perform some controls when conditions are met trace The operation of .
A trigger doesn’t need any recording session to exist: it belongs to a session daemon.
Just look at the examples :
towards root session daemon Add trigger control trace:
Condition
An event rule matches a Linux kernel system call event of which the name starts with exec and */ls matches the filename payload field.
With such an event rule, LTTng emits an event when the ls program starts.
call ls Is triggered when . This requires an understanding of system calls ~~~
Action
Start the recording session named pitou.
When the conditions are met record start.
lttng-sessiond --daemonize # without daemon Words

lttng create pitou # establish  record session  It should be the default channel 0 Well
lttng enable-event --kernel --syscall --all  # Write ER , kernel domain Of

lttng add-trigger --condition=event-rule-matches \
                  --type=syscall --name='exec*' \
                  --filter='filename == "*/ls"' \
                  --action=start-session pitou

lttng list-triggers # Confirm to add trigger success

lttng list pitou

 return  Recording session pitou: [inactive]

ls ~

lttng list pitou

 return  Recording session pitou: [active]
Send to the program notify
This may help write some test programs . It involves the user's own program development .
It's too advanced for me at present ... Let's discuss it later .
The example is to make APP Print call bash Instructions .
边栏推荐
- 脚本执行方式
- (7) Vulhub column: log4j Remote Code Execution Vulnerability recurrence
- Chapter 8: custom exception return
- MySQL connection query using Convert in on causes the number of scan lines to increase
- pkg-config 查找库和用于编译
- Desensitization of mobile phone, name and ID card information in the project in the log and response data
- BUUCTF闯关日记04--[ACTF2020 新生赛]Include1
- [pytorch deep learning practice] learning notes section 4 back propagation
- BUUCTF闯关日记04--[强网杯 2019]随便注1
- 【PyTorch深度学习实践】学习笔记 第四节 反向传播
猜你喜欢

![BUUCTF闯关日记--[MRCTF2020]Ezpop1](/img/04/14e9490bb70f3322860751007f23d4.png)


![[lttng learning journey] ----- core concepts](/img/63/94be53a6c726b653e86027facad5e8.png)


随机推荐
嵌入式系統學習筆記
MySQL connection query using Convert in on causes the number of scan lines to increase
Wechat applet cannot read property'setdata'of null error
Redis series 13 -- redis Sentinel
BUUCTF闯关日记--[NCTF2019]Fake XML cookbook
给table的td设置了 colspan 失效
Redis 系列14--Redis Cluster
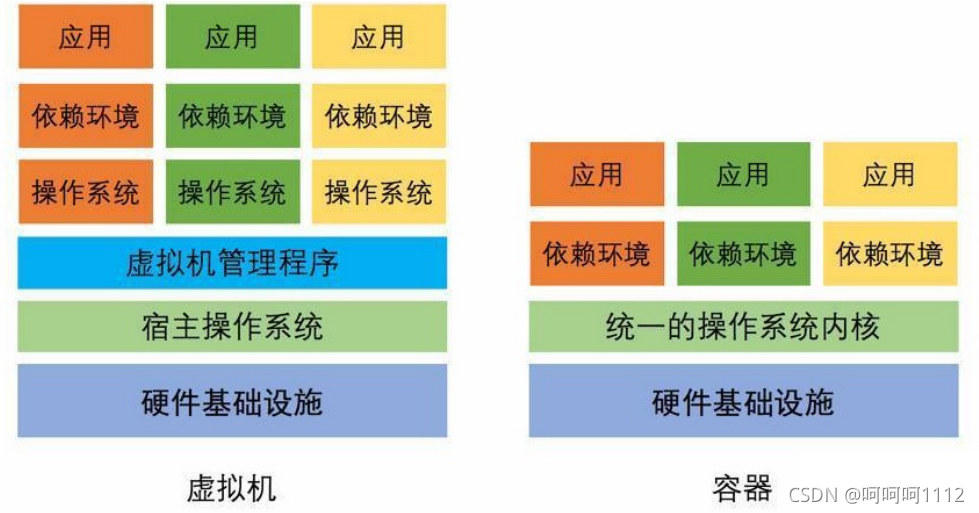
1.虚拟化和容器技术
Airtest conducts webui automated testing (selenium)
mysql 连接查询在on中使用convert 导致扫描行数增长
Bash变量--环境变量
Embedded system learning notes
JVM principle and performance tuning
Bash基本功能—多命令顺序执行与管道符
Bishett route - hyperspectral image classification with deep learning in pytorch environment
第二章:minio单机版,使用客户端备份文件
Pycharm settings
Rapid construction of the locust testing framework
Django中使用Mysql数据库
Chapter 6: EASYCODE code generator