当前位置:网站首页>Sequences, Time Series and Prediction in Tessorflow quizs on Coursera (一)
Sequences, Time Series and Prediction in Tessorflow quizs on Coursera (一)
2022-07-21 11:14:00 【黄水生】
声明:本博客涉及的内容仅供个人学习使用,方便后续复习总结,请勿用做商业用途
第一周知识点总结:
(1)几种常见的时间序列
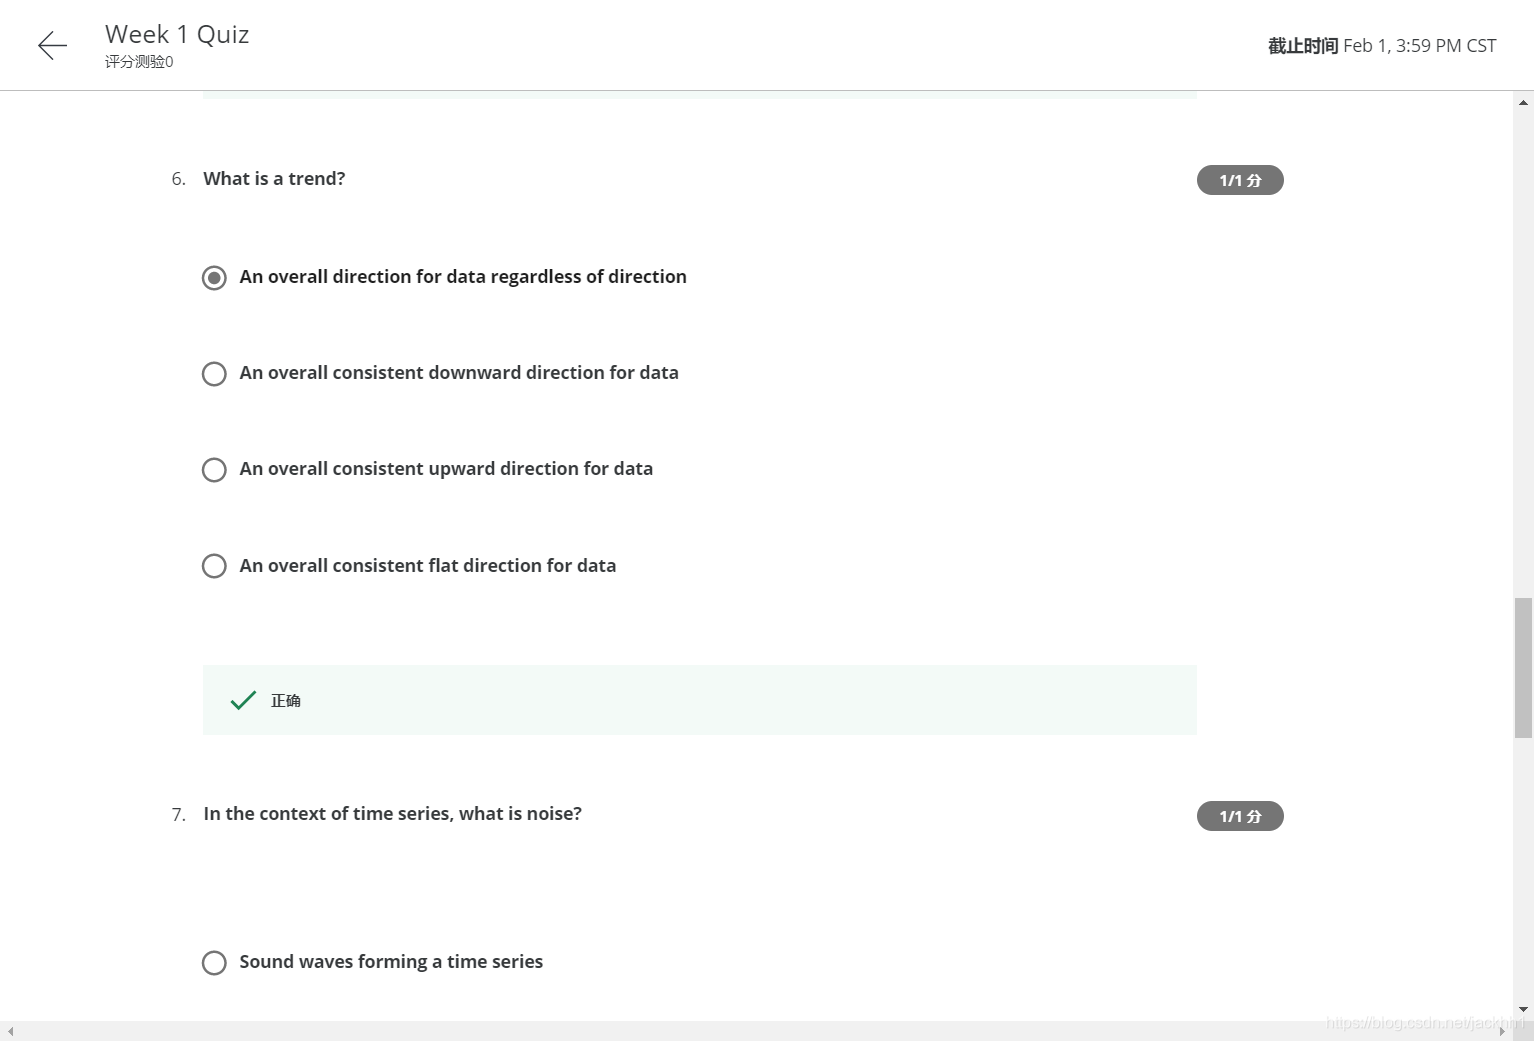
–趋势序列(trend):朝一个特定方向变化
import numpy as np
import matplotlib.pyplot as plt
import tensorflow as tf
from tensorflow import keras

def plot_series(time, series, format="-", start=0, end=None, label=None):
    plt.plot(time[start:end], series[start:end], format, label=label)
    plt.xlabel("Time")
    plt.ylabel("Value")
    if label:
        plt.legend(fontsize=14)
    plt.grid(True)

def trend(time, slope=0):
    return slope * time
time = np.arange(4 * 365 + 1)
baseline = 10
series = trend(time, 0.1)

plt.figure(figsize=(10, 6))
plot_series(time, series)
plt.show()

–季节序列:周期性变化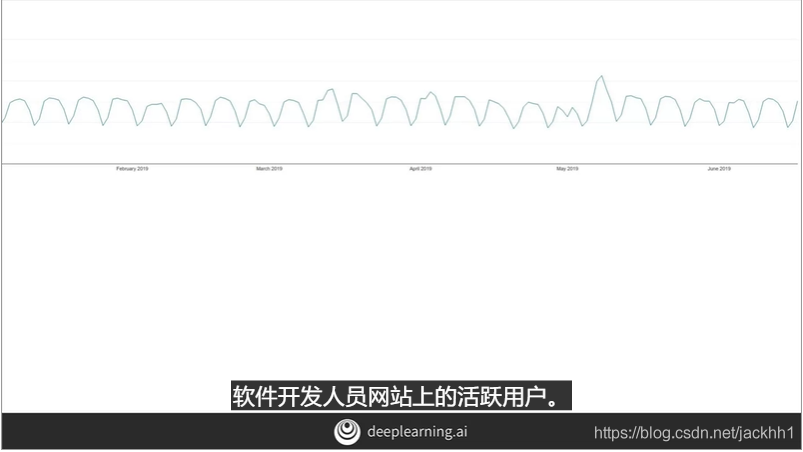
相关代码:
def seasonal_pattern(season_time):
    """Just an arbitrary pattern, you can change it if you wish"""
    return np.where(season_time < 0.4,
                    np.cos(season_time * 2 * np.pi),
                    1 / np.exp(3 * season_time))

def seasonality(time, period, amplitude=1, phase=0):
    """Repeats the same pattern at each period"""
    season_time = ((time + phase) % period) / period
    return amplitude * seasonal_pattern(season_time)
baseline = 10
amplitude = 40
series = seasonality(time, period=365, amplitude=amplitude)

plt.figure(figsize=(10, 6))
plot_series(time, series)
plt.show()

slope = 0.05
series = baseline + trend(time, slope) + seasonality(time, period=365, amplitude=amplitude)

plt.figure(figsize=(10, 6))
plot_series(time, series)
plt.show()

–噪声序列:无法预测的白噪声随机值
def white_noise(time, noise_level=1, seed=None):
    rnd = np.random.RandomState(seed)
    return rnd.randn(len(time)) * noise_level
noise_level = 5
noise = white_noise(time, noise_level, seed=42)

plt.figure(figsize=(10, 6))
plot_series(time, noise)
plt.show()

往时间序列里加噪声
series += noise

plt.figure(figsize=(10, 6))
plot_series(time, series)
plt.show()

–Autocorrelation: auto correlated time series. Namely it correlates with a delayed copy of itself often called a lag.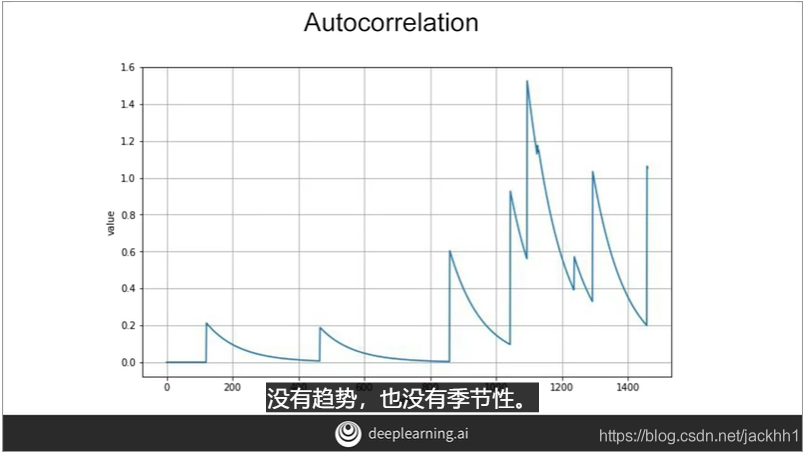

–现实生活中的时间序列一般被认为是上面这四种时间序列的组合,即“Trend + Seasonality + Autocorrelation + Noise”
下面的代码就是讲上面几种时间序列进行组合
split_time = 1000
time_train = time[:split_time]
x_train = series[:split_time]
time_valid = time[split_time:]
x_valid = series[split_time:]

def autocorrelation(time, amplitude, seed=None):
    rnd = np.random.RandomState(seed)
    φ1 = 0.5
    φ2 = -0.1
    ar = rnd.randn(len(time) + 50)
    ar[:50] = 100
    for step in range(50, len(time) + 50):
        ar[step] += φ1 * ar[step - 50]
        ar[step] += φ2 * ar[step - 33]
    return ar[50:] * amplitude
def autocorrelation(time, amplitude, seed=None):
    rnd = np.random.RandomState(seed)
    φ = 0.8
    ar = rnd.randn(len(time) + 1)
    for step in range(1, len(time) + 1):
        ar[step] += φ * ar[step - 1]
    return ar[1:] * amplitude
series = autocorrelation(time, 10, seed=42)
plot_series(time[:200], series[:200])
plt.show()

series = autocorrelation(time, 10, seed=42) + trend(time, 2)
plot_series(time[:200], series[:200])
plt.show()

series = autocorrelation(time, 10, seed=42) + seasonality(time, period=50, amplitude=150) + trend(time, 2)
plot_series(time[:200], series[:200])
plt.show()

series = autocorrelation(time, 10, seed=42) + seasonality(time, period=50, amplitude=150) + trend(time, 2)
series2 = autocorrelation(time, 5, seed=42) + seasonality(time, period=50, amplitude=2) + trend(time, -1) + 550
series[200:] = series2[200:]
#series += noise(time, 30)
plot_series(time[:300], series[:300])
plt.show()

def impulses(time, num_impulses, amplitude=1, seed=None):
    rnd = np.random.RandomState(seed)
    impulse_indices = rnd.randint(len(time), size=10)
    series = np.zeros(len(time))
    for index in impulse_indices:
        series[index] += rnd.rand() * amplitude
    return series

series = impulses(time, 10, seed=42)
plot_series(time, series)
plt.show()

def autocorrelation(source, φs):
    ar = source.copy()
    max_lag = len(φs)
    for step, value in enumerate(source):
        for lag, φ in φs.items():
            if step - lag > 0:
              ar[step] += φ * ar[step - lag]
    return ar
signal = impulses(time, 10, seed=42)
series = autocorrelation(signal, {
    1: 0.99})
plot_series(time, series)
plt.plot(time, signal, "k-")
plt.show()
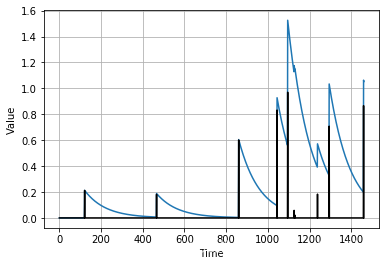
signal = impulses(time, 10, seed=42)
series = autocorrelation(signal, {
    1: 0.70, 50: 0.2})
plot_series(time, series)
plt.plot(time, signal, "k-")
plt.show()

series_diff1 = series[1:] - series[:-1]
plot_series(time[1:], series_diff1)

—Non-Stationary Time Series:发生某个事件后,序列与过去的时间发生很大变化的时间序列,像股票走势。
对于这样的序列,我们一般只需要后面的时间数据进行训练,以后前面的数据对我们后续的预测没有多大作用
–天真预测(naive forecast):取序列的最后一个值,并且假设后面的值与它相同,我们一般用天真预测值作为时间序列模型的基线(baseline)指标。
时间序列模型中的一些性能指标:mse和mae 第一周测验:第二题选D


边栏推荐
- Intel assembler programming - integer arithmetic instructions (Part 1)
- 数据中心末端直流配电系统产品的应用
- 从0开始实现一个代理池
- 执掌英国工程技术学会13载,范纳杰正式退休
- Advanced Fruits(公共子序列)
- Part 101 blind box smart contract (erc1155)
- [mid 2022 summary] I walk very slowly, but I never retreat
- A trick to teach you how to master online videos
- ModelArts、盘古大模型、ModelBox…详解华为云AI开发生产线
- 线程理论知识
猜你喜欢

网站为什么会有漏洞要去修补

Design and application of prepaid platform on power reform policy

How to make the full-color LED display screen energy-saving and environmental protection?

浅谈 Service Worker 在缓存资源以及Web Push上的应用
预付费平台关于电改政策的设计与应用

Code management (novice)
![[mid 2022 summary] I walk very slowly, but I never retreat](/img/47/855829cd23ae219e9b72d7c7f95edd.jpg)
[mid 2022 summary] I walk very slowly, but I never retreat

科创人·观远数据CEO苏春园:让业务用起来,是BI行业推倒渗透率之墙的关键

seaborn绘制箱线图和折线图

Intel assembler programming - integer arithmetic instructions (Part 1)
随机推荐
斯坦福CV课程学习笔记(一)
ANSVC无功补偿装置助力江苏某环保能源项目
MySQL 5.7.9版本sql_mode=only_full_group_by问题
Seaborn draws box chart and line chart
Gsyvideoplayer slide refresh video
Intel assembler programming - integer arithmetic instructions (Part 1)
运动员和教练案例代码
Run busybox, buildroot, loognix, qt5.12 system for Godson development board process
Seckill design
真人踩过的坑,告诉你避免自动化测试新手常犯的10个错误
JS部分
Design and application of prepaid platform on power reform policy
Part 108 compound simple deployment
进程池及回掉函数[通俗易懂]
Calendar常用方法
Dialogue ace phase IV: challenges and opportunities for the future development of distributed databases
System
日期工具类
抽象类名作为形参和返回值
C language exercises - structure and union